el Niño "Modoki"


Sunday, 13 November 2011

Explaining El Nino and La Nina


Amazon fire season 'linked to                ocean temperature'

Smouldering remains of a forest fire, Brazil (Image: Guido van der Werf)The team developed a model that offers a fire season forecast up to five months in advance

Related Stories

Sea surface temperature (SST) anomalies can help predict the severity of Amazon fire seasons, a study has suggested.
A team of US scientists found there was a correlation between El Nino patterns in the Pacific and fire activity in the eastern Amazon.
Writing in the journal Science, they say they also found a link between Atlantic SST changes and fires in southern areas of South America.
They said the data could help produce forecasts of forthcoming fire seasons.
"We found that the Oceanic Nino Index (ONI) was correlated with interannual fire activity in the eastern Amazon, whereas the Atlantic Multidecadal Oscillation (AMO) index was more closely linked with fires in the southern and south-western Amazon," they wrote.
'Early warning'
"Combining these two indices, we developed an empirical model to forecast regional fire severity with lead times of three to five months," they explained.
"Our approach may contribute to the development of an early warning system for anticipating the vulnerability of Amazon forests to fires."
Previous studies have shown "high-fire" years in South America are generally associated with an extended dry season and low levels of rainfall.
It has also been shown that variations in precipitation levels in the Amazon is regulated by SSTs in the Atlantic and Pacific oceans.
"The most severe droughts observed in the Amazon over the past three decades have occurred when the tropical eastern Pacific and North Atlantic were anomalously warm," they said.
A reliable early warning system would be a key tool for relevant bodies and agencies to focus policies and resources effectively, observed the researchers, drawn from a number of US institutes.
"Managing fires to conserve biodiversity and carbon stocks in forest and savannah ecosystems requires advance planning on multiple timescales," they said.
These include "design of policy mechanisms that modify long-term development, as well as improved use of short-term meterorological forecasts of fire behaviour during years with high fire season severity."


El Niño "Modoki" and Central-Pacific El Niño


Map showing Nino3.4 and other index regions

Map of Atlantic major hurricanes during post-"Modoki" seasons, including 1987,199219952003 and 2005.
The traditional Niño, also called Eastern Pacific (EP) El Niño,[57] involves temperature anomalies in the Eastern Pacific. However, in the last two decades non-traditional El Niños were observed, in which the usual place of the temperature anomaly (Nino 1 and 2) is not affected, but an anomaly arises in the central Pacific (Nino 3.4).[58] The phenomenon is called Central Pacific (CP) El Niño,[57] "dateline" El Niño (because the anomaly arises near the dateline), or El Niño "Modoki" (Modoki is Japanese for "similar, but different").[59]
The effects of the CP El Niño are different from those of the traditional EP El Niño — e.g., the new El Niño leads to more hurricanes more frequently making landfall in the Atlantic.[60]
The recent discovery of El Niño Modoki has some scientists believing it to be linked to global warming.[61] However, Satellite data goes back only to 1979. More research must be done to find the correlation and study past El Niño episodes.
The first recorded El Niño that originated in the central Pacific and moved toward the east was in 1986.[62]
A joint study by the National Aeronautics and Space Administration and the National Oceanic and Atmospheric Administration concluded that climate change may contribute to stronger El Niños. El Niño "Modoki" events occurred in 1991-92, 1994–95, 2002–03, 2004–05, and 2009-10.[63] The strongest such Central Pacific El Niño event known occurred in 2009-2010

Cultural history and pre-historic information


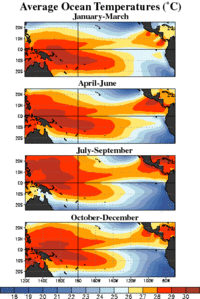
Average equatorial Pacific temperatures
ENSO conditions have occurred at two- to seven year intervals for at least the past 300 years, but most of them have been weak. There is also evidence for strong El Niño events during the earlyHolocene epoch 10,000 years ago.[68]
El Niño affected pre-Columbian Incas [69] and may have led to the demise of the Moche and other pre-Columbian Peruvian cultures.[70] A recent study suggests that a strong El-Niño effect between 1789–93 caused poor crop yields in Europe, which in turn helped touch off the French Revolution.[71] The extreme weather produced by El Niño in 1876–77 gave rise to the most deadly famines of the 19th century.[72]
An early recorded mention of the term "El Niño" to refer to climate occurs in 1892, when Captain Camilo Carrillo told the Geographical society congress in Lima that Peruvian sailors named the warm northerly current "El Niño" because it was most noticeable around Christmas. The phenomenon had long been of interest because of its effects on the guano industry and other enterprises that depend on biological productivity of the sea.
Charles Todd, in 1893, suggested that droughts in India and Australia tended to occur at the same time; Norman Lockyer noted the same in 1904. An El Niño connection with flooding was reported in 1895 by Pezet and Eguiguren. In 1924, Gilbert Walker (for whom the Walker circulation is named) coined the term "Southern Oscillation".
The major 1982–83 El Niño led to an upsurge of interest from the scientific community. The period from 1990–1994 was unusual in that El Niños have rarely occurred in such rapid succession.[73] An especially intense El Niño event in 1998 caused an estimated 16% of the world's reef systems to die. The event temporarily warmed air temperature by 1.5 °C, compared to the usual increase of 0.25 °C associated with El Niño events.[74] Since then, mass coral bleaching has become common worldwide, with all regions having suffered "severe bleaching".[75]
Major ENSO events were recorded in the years 1790–93, 1828, 1876–78, 1891, 1925–26, 1972–73, 1982–83, and 1997–98, with 2010–2011 being one of the strongest ever

windy weston plus